Unparalleled intelligence on the spectrum landscape
Save time, find opportunities, and make data-driven decisions using the most advanced platform for spectrum research. Trusted by companies across the wireless ecosystem.
Airwave Research is used by
Airwave Research is used by
"Airwave's new dynamic and flexible platform is unparalleled in speed and efficiency when searching the ULS database or other spectrum queries. The visualization and graphics are a nice addition to an otherwise fantastic product."

"A unique way to view spectrum holdings more clearly than any tool ever created."


The problem.
Spectrum is complicated, and the ULS doesn't make it any easier.
What recent applications have been filed in PEA001?
What would the screen look like if Verizon acquired this list of call signs?
Who owns the PCS C block in Hennepin County, MN?
What is the worth of the recent UScellular deal?
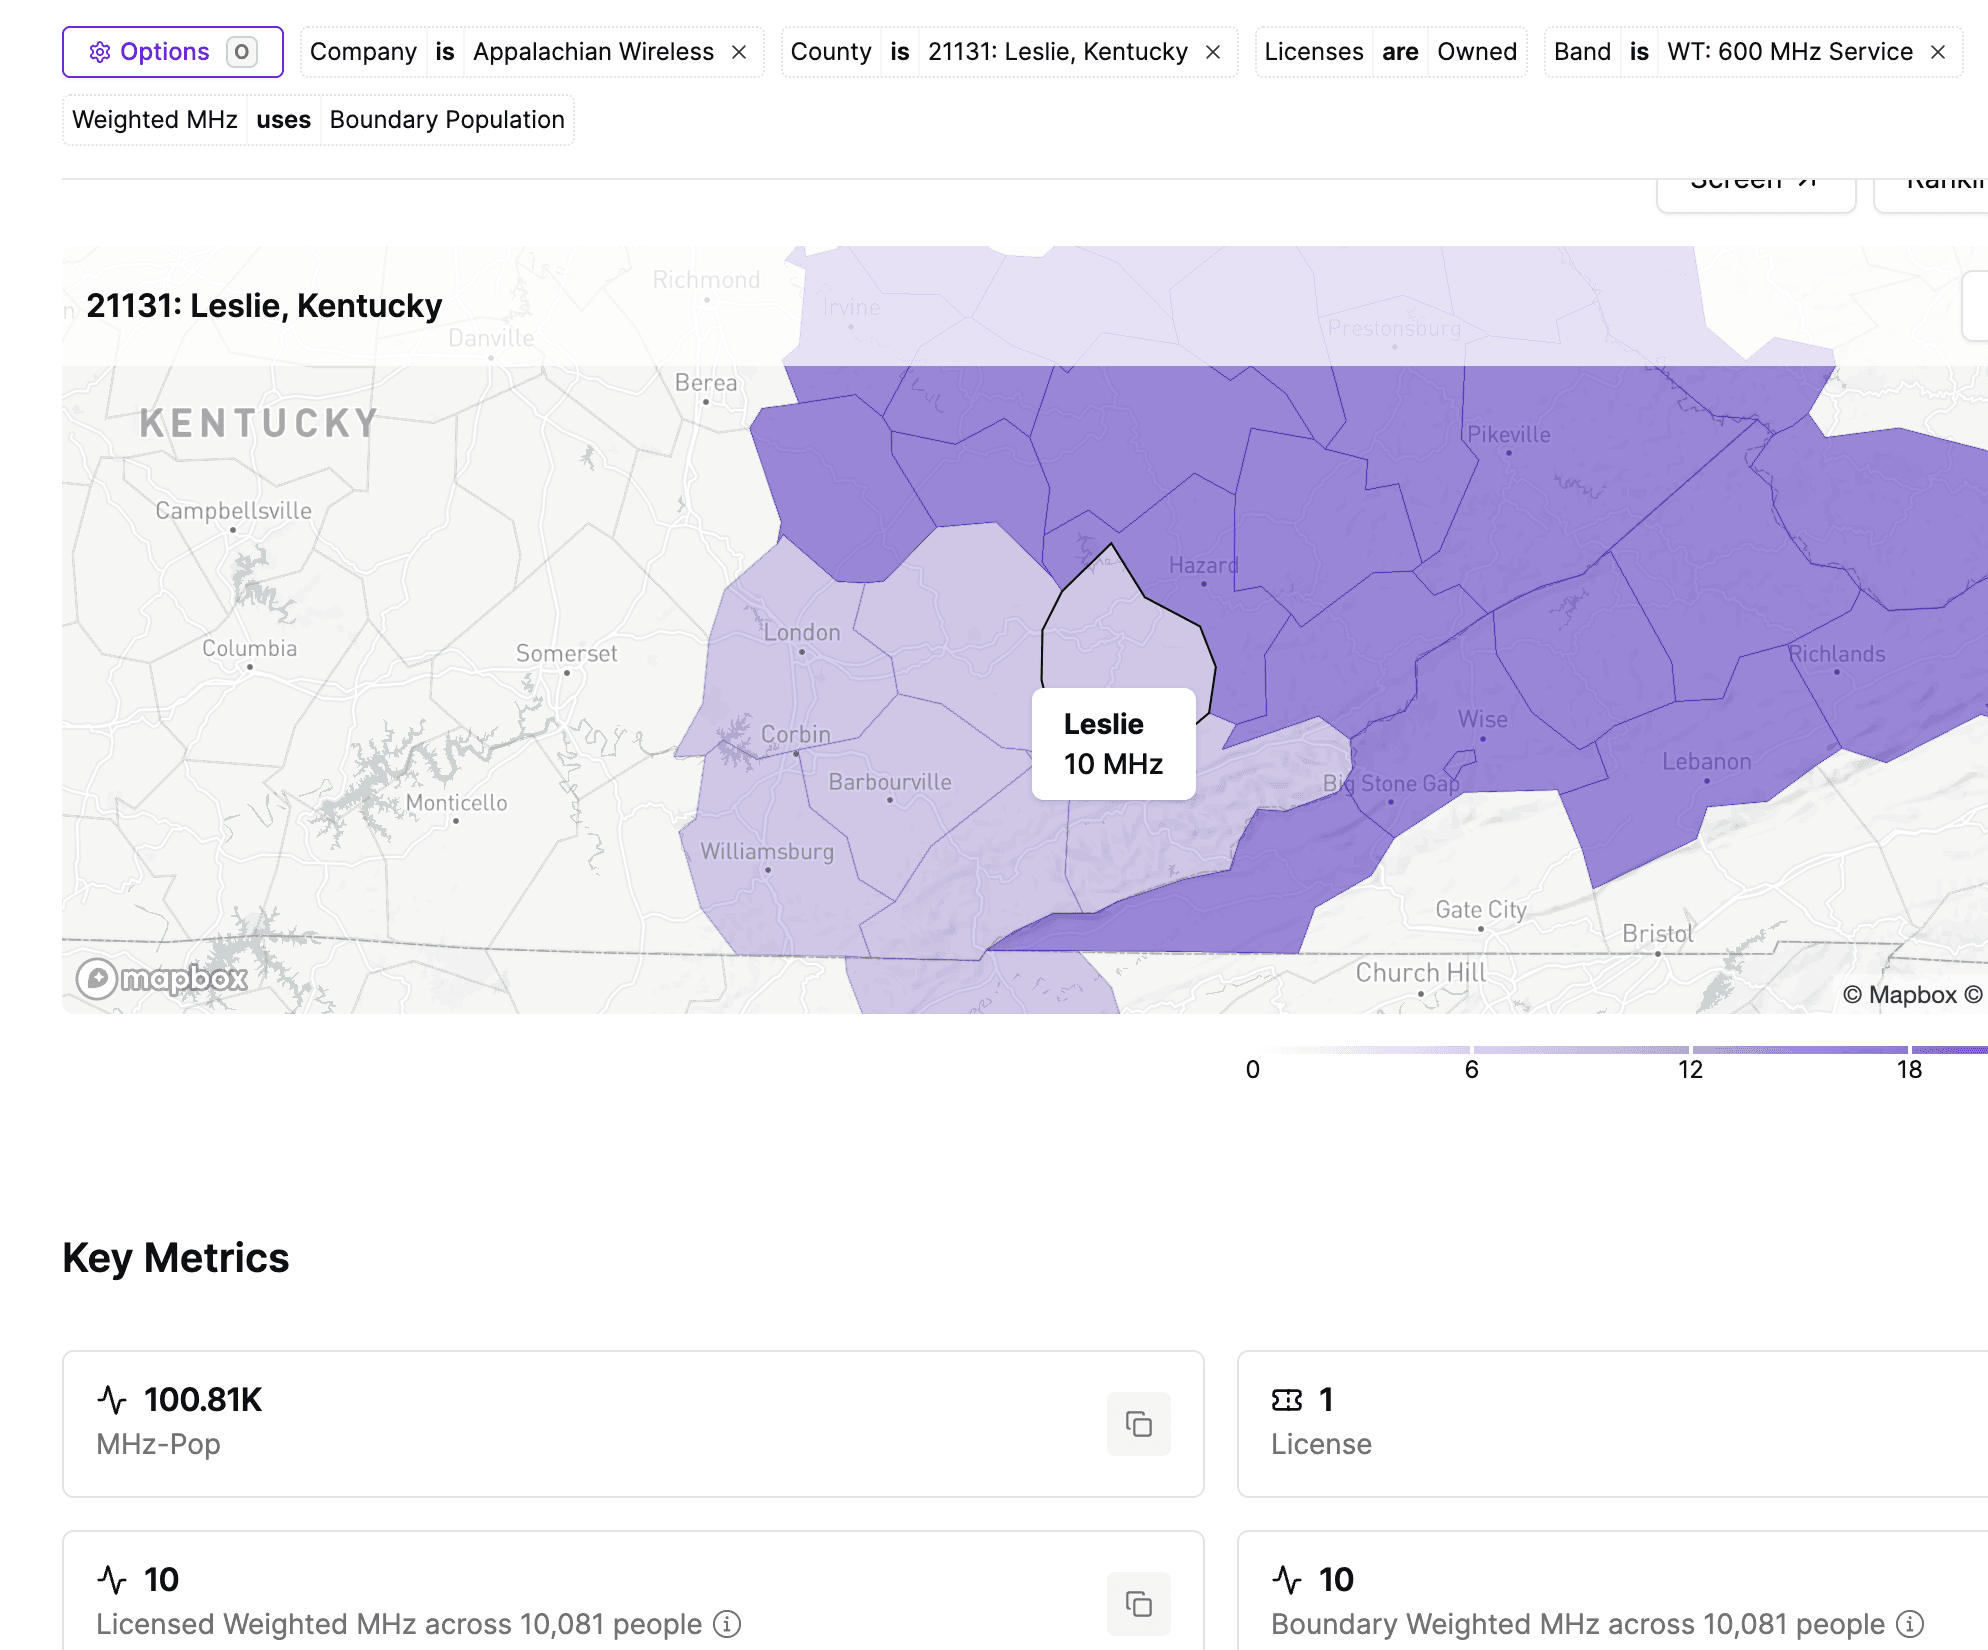
What does the spectrum footprint of Appalachian Wireless look like?
Who is the right buyer for my 2.5 GHz spectrum?
What recent applications have been filed in PEA001?
What would the screen look like if Verizon acquired this list of call signs?
Who owns the PCS C block in Hennepin County, MN?
What is the worth of the recent UScellular deal?
What does the spectrum footprint of Appalachian Wireless look like?
Who is the right buyer for my 2.5 GHz spectrum?
What spectrum does Verizon own in 28 GHz?
Who owns each block in AWS-3 in New York?
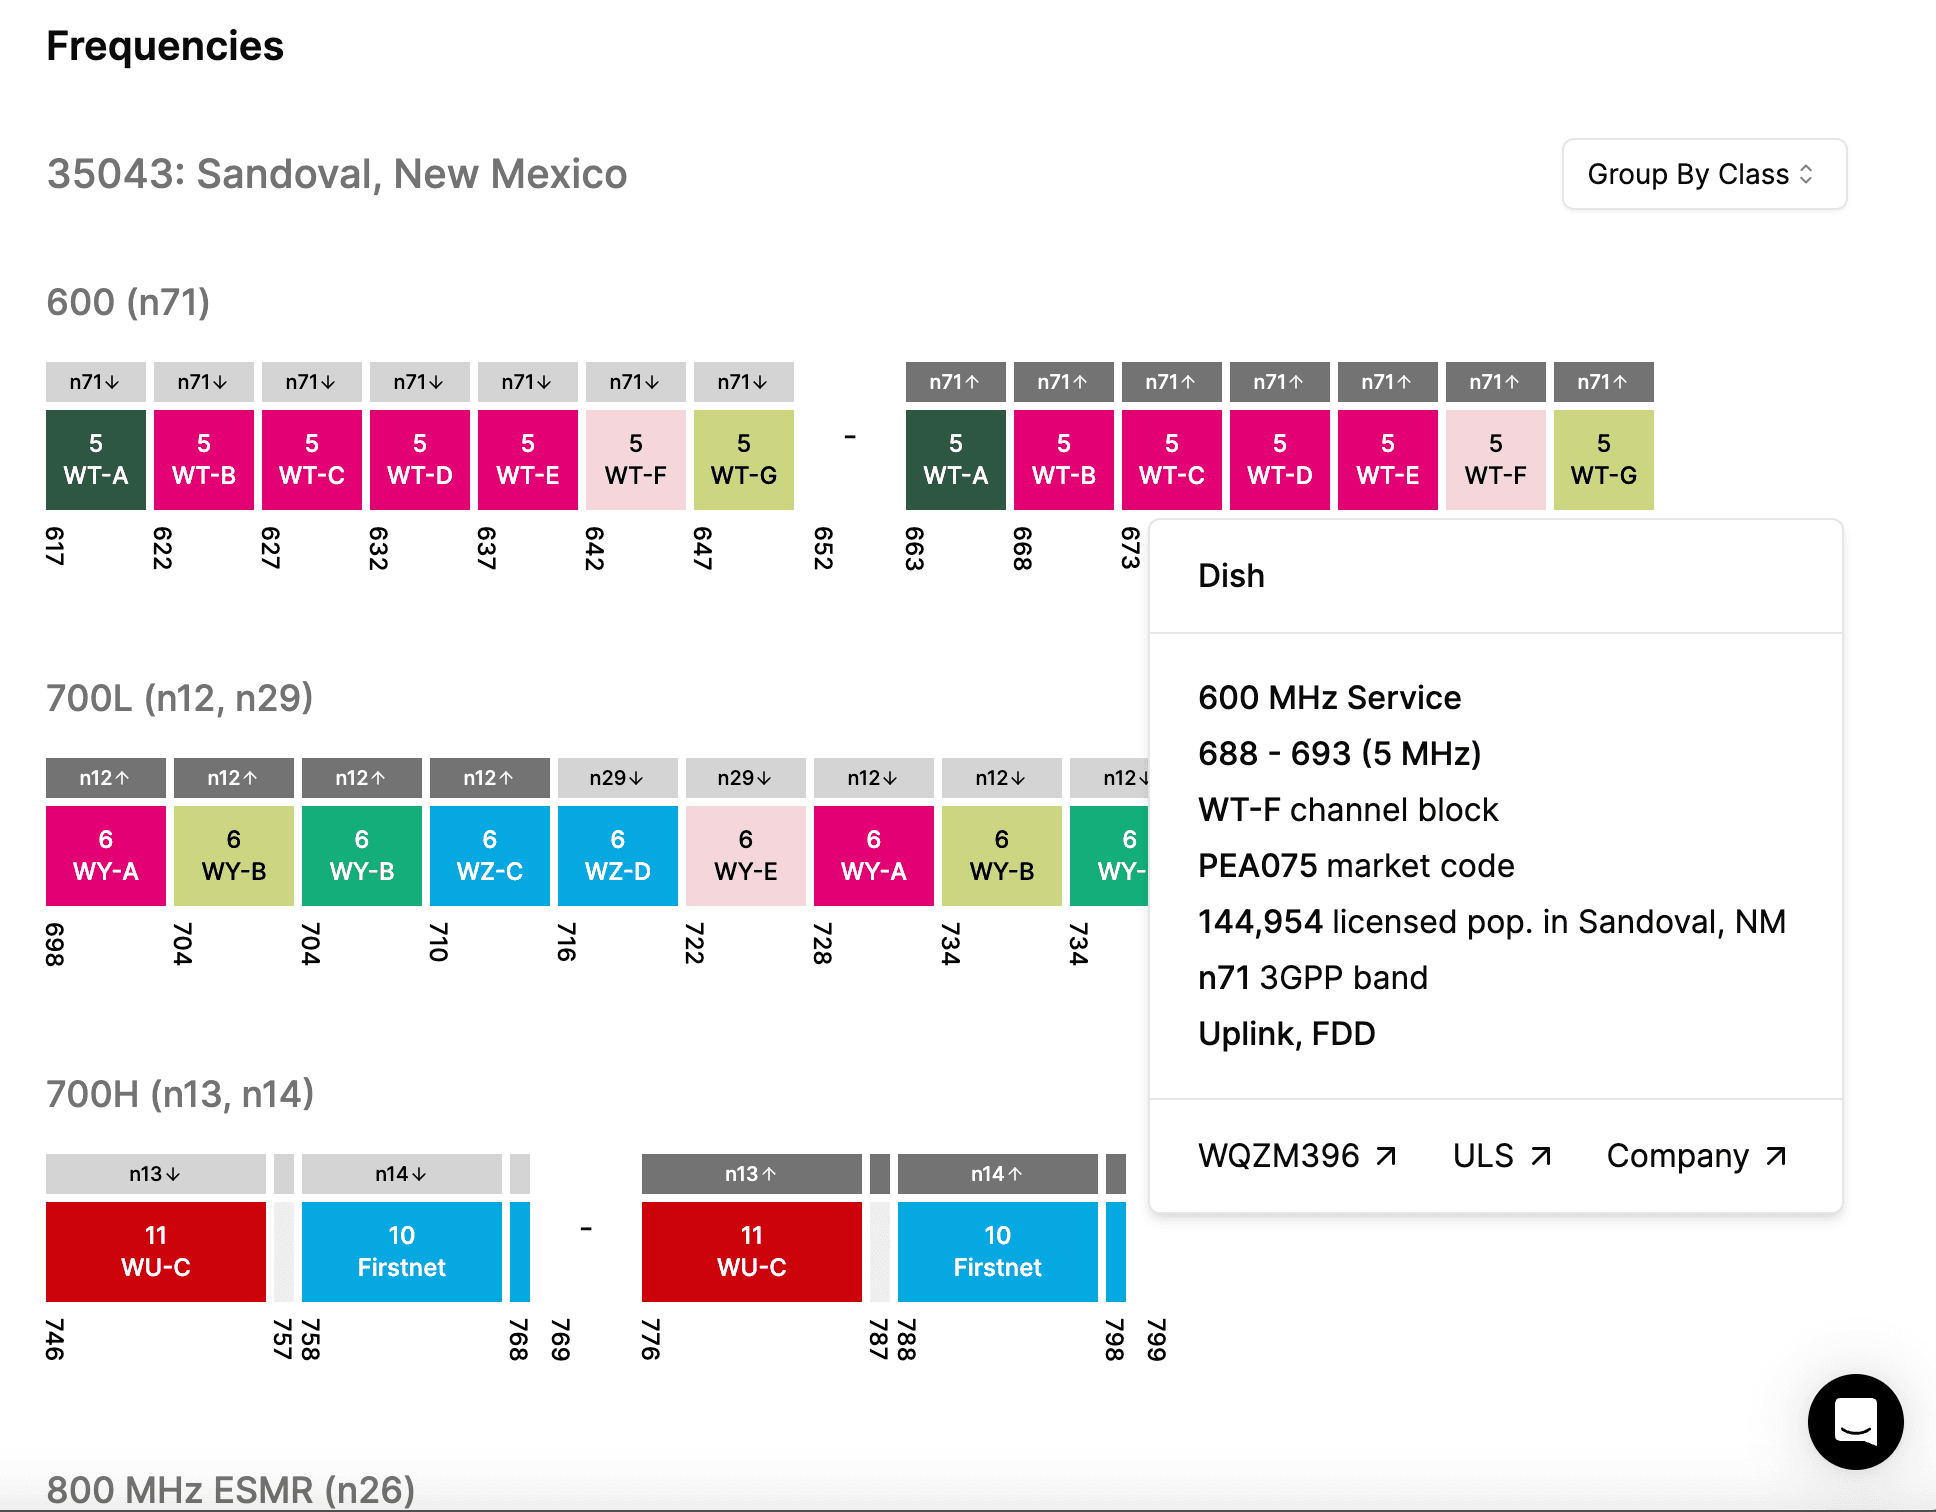
Which Dish licenses have outstanding buildout requirements?
What is the shape of these BRS/EBS licenses in the A block?
Who else owns spectrum in my spectrum footprint?
What has low band spectrum been purchased for in the last 10 years?
What price was paid for AWS-3 spectrum in Miami?
What spectrum does Verizon own in 28 GHz?
Who owns each block in AWS-3 in New York?
Which Dish licenses have outstanding buildout requirements?
What is the shape of these BRS/EBS licenses in the A block?
Who else owns spectrum in my spectrum footprint?
What has low band spectrum been purchased for in the last 10 years?
What price was paid for AWS-3 spectrum in Miami?
How many MHz-Pop's were transferred in the recent T-Mobile deal?
What coordination zones are there in AWS-4?
What MVDDS spectrum does Dish own in the US?
What are the key factors influencing spectrum valuation?
What is the status of this application?
How much is Dish's spectrum worth?
Who is the top low-mid band spectrum owner in the US's top 10 markets?
The solution.
An all-in-one platform to understand the spectrum landscape.
Achieve clarity.
Deepen your understanding by getting accurate answers to the most complex questions.
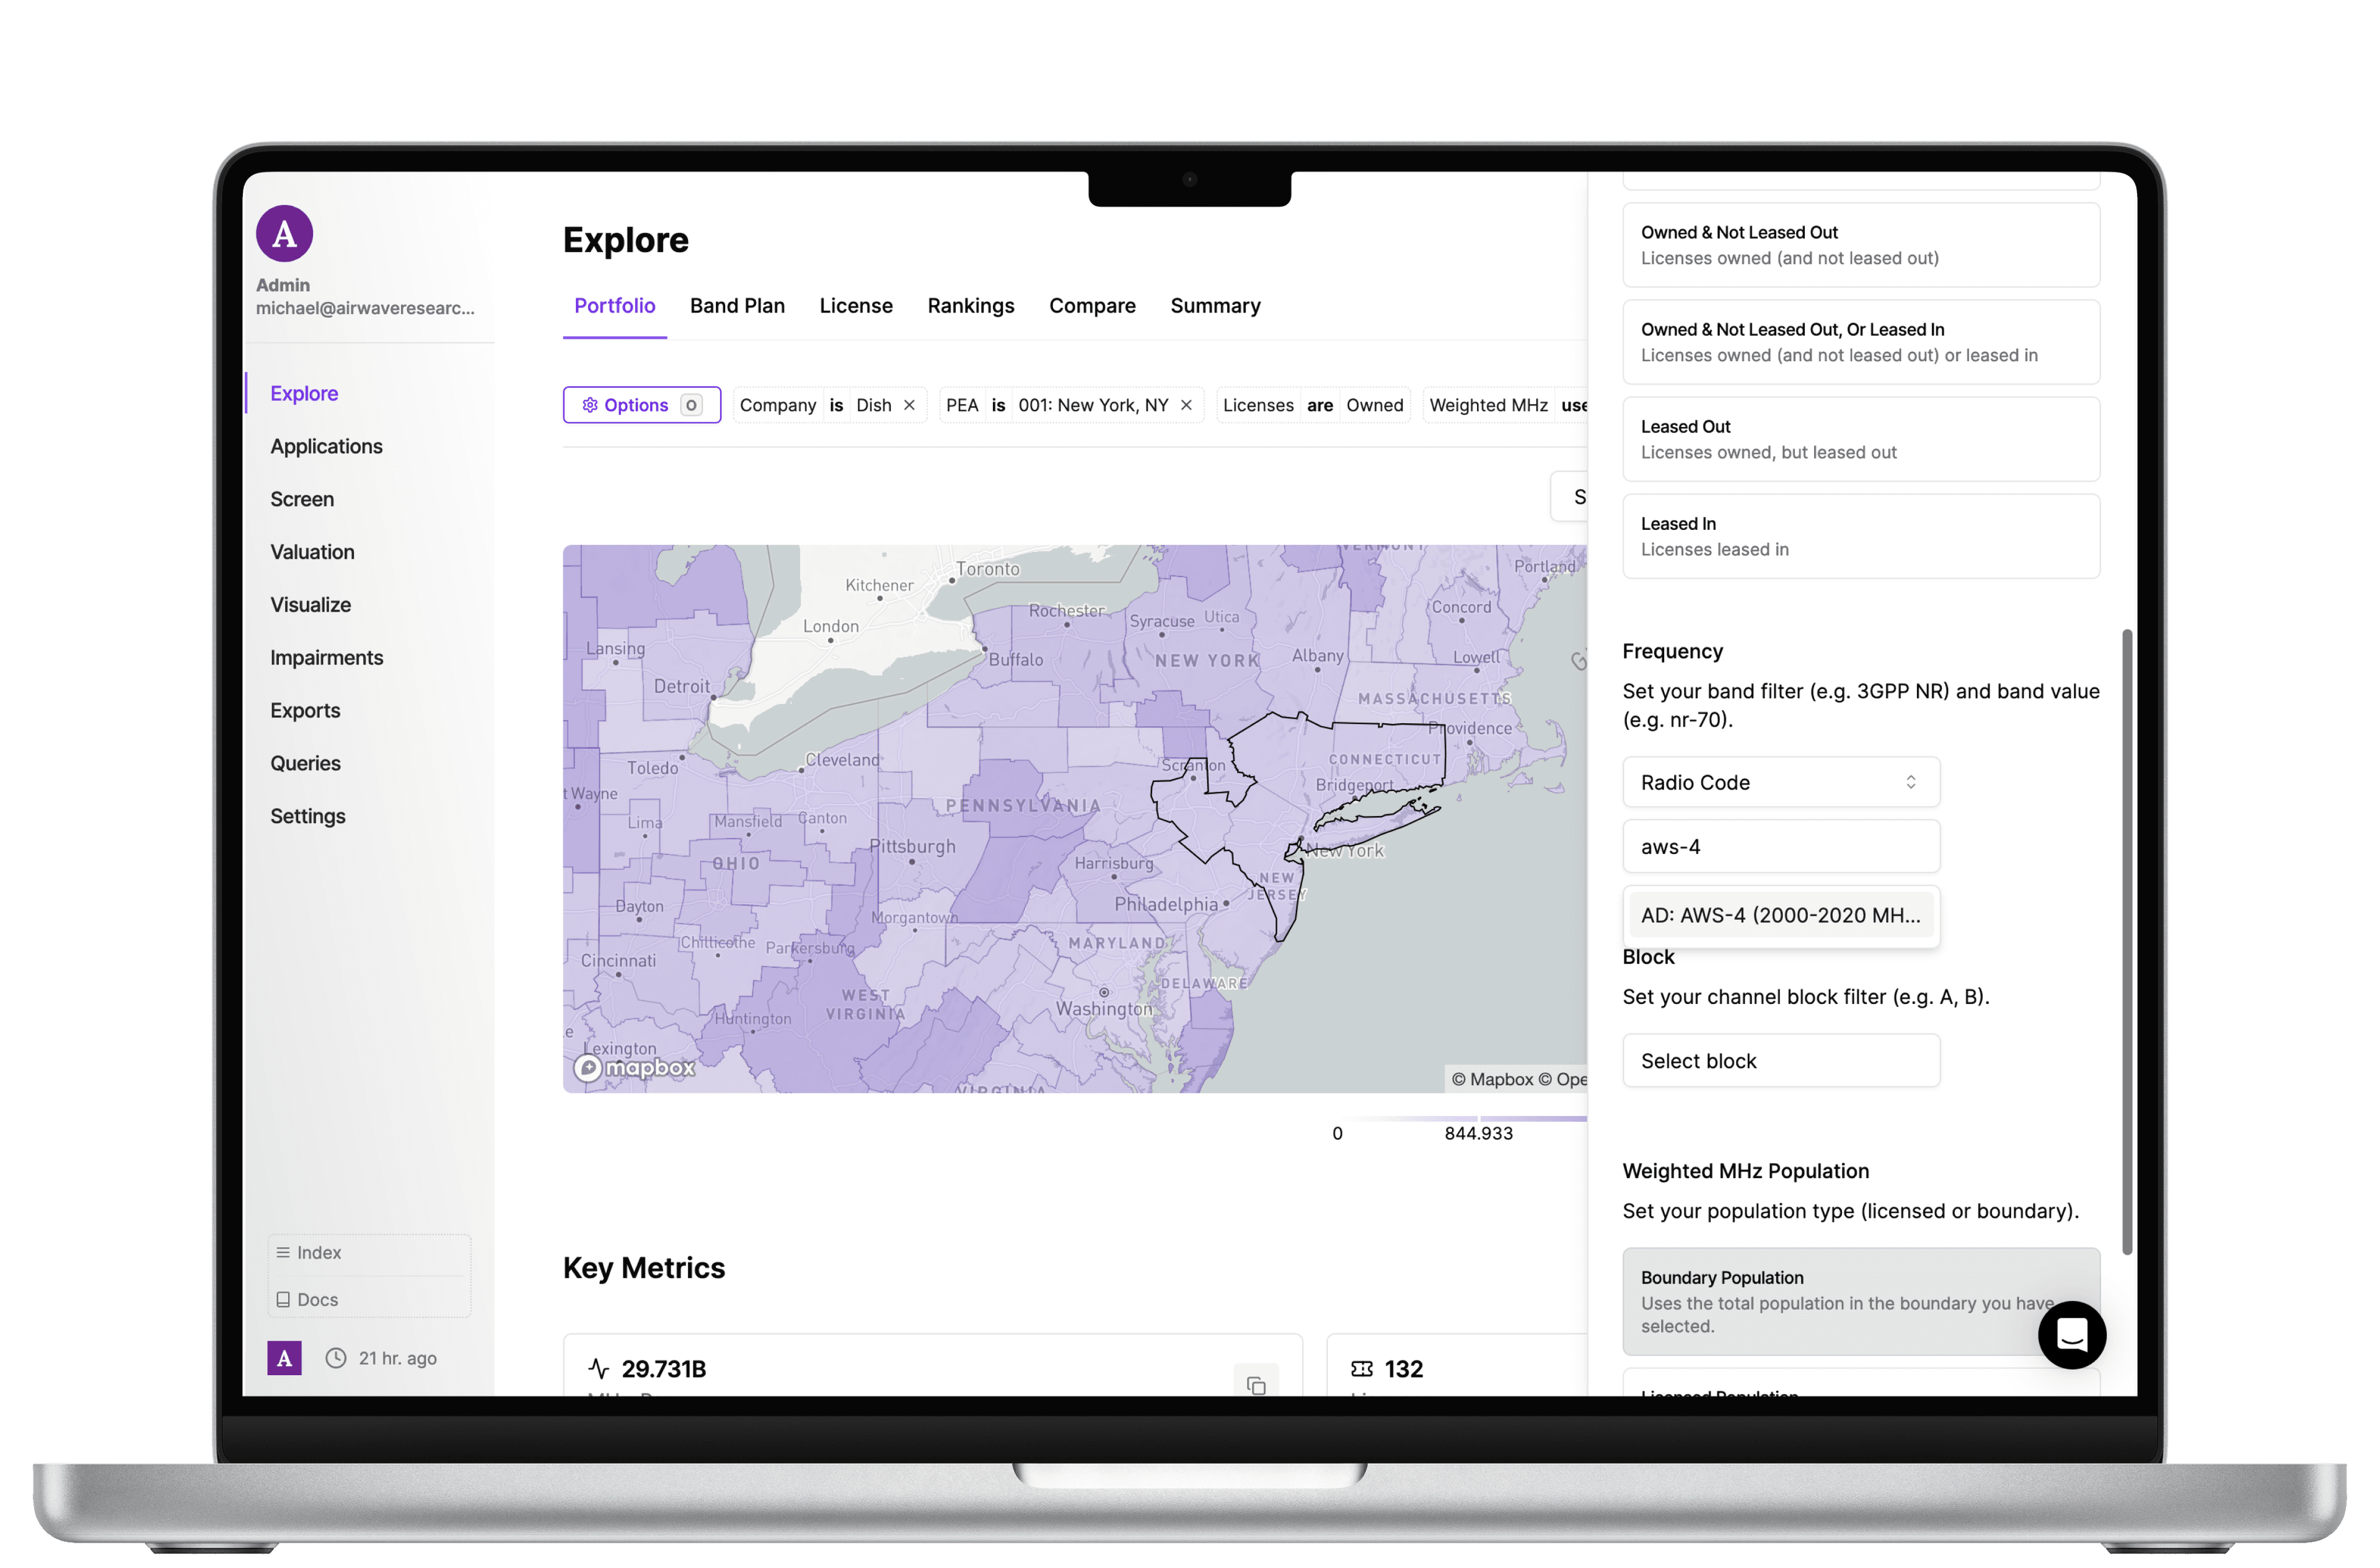
Intuitive Ownership Data
We have processed, cleaned, and enriched ULS data to provide easy-to-understand visualizations of spectrum ownership. Our system succinctly answers even the most complex questions.
Flexible Querying Capabilities
Apply filters across bands, markets, leasing statuses, blocks, geographic areas, and companies to narrow down your search in seconds. Use our mapping functionality to visualize the results instantly.
Advanced Visualization
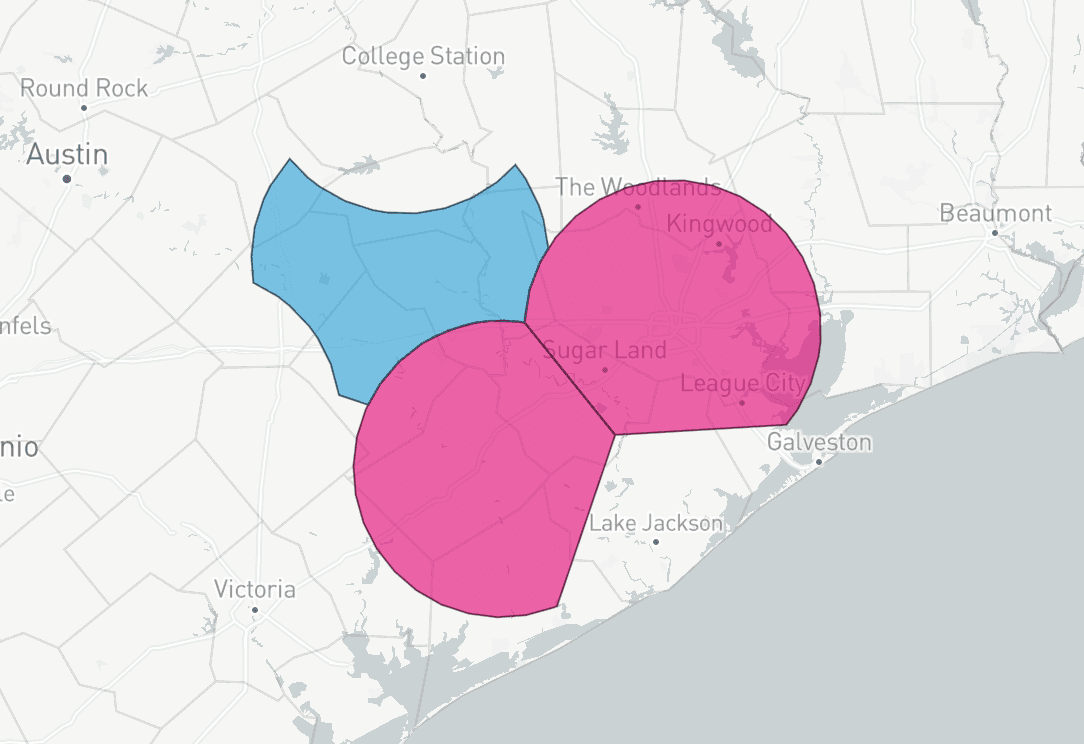
Dedicated tooling to quickly visualize spectrum holdings which do not conform to county borders, such as BRS/EBS, partitions, and cellular GSA's.
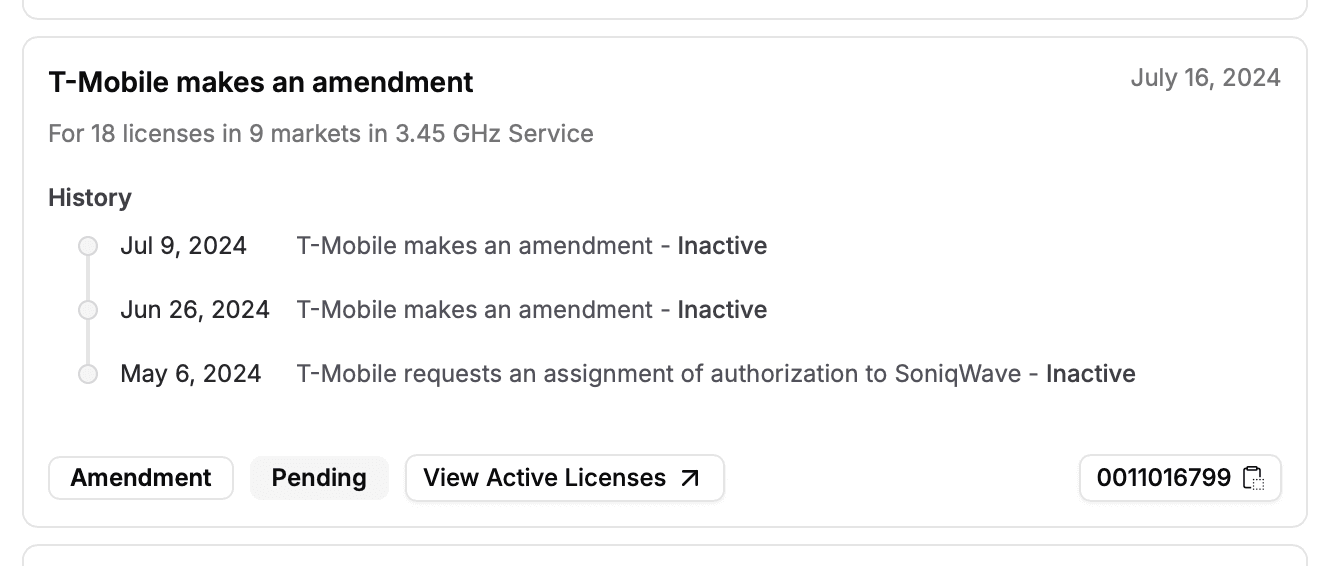
Real-time Application Tracking
Track changes to spectrum licensure with ease and receive digest emails to stay up-to-date. We link application data with holdings to provide a complete picture.
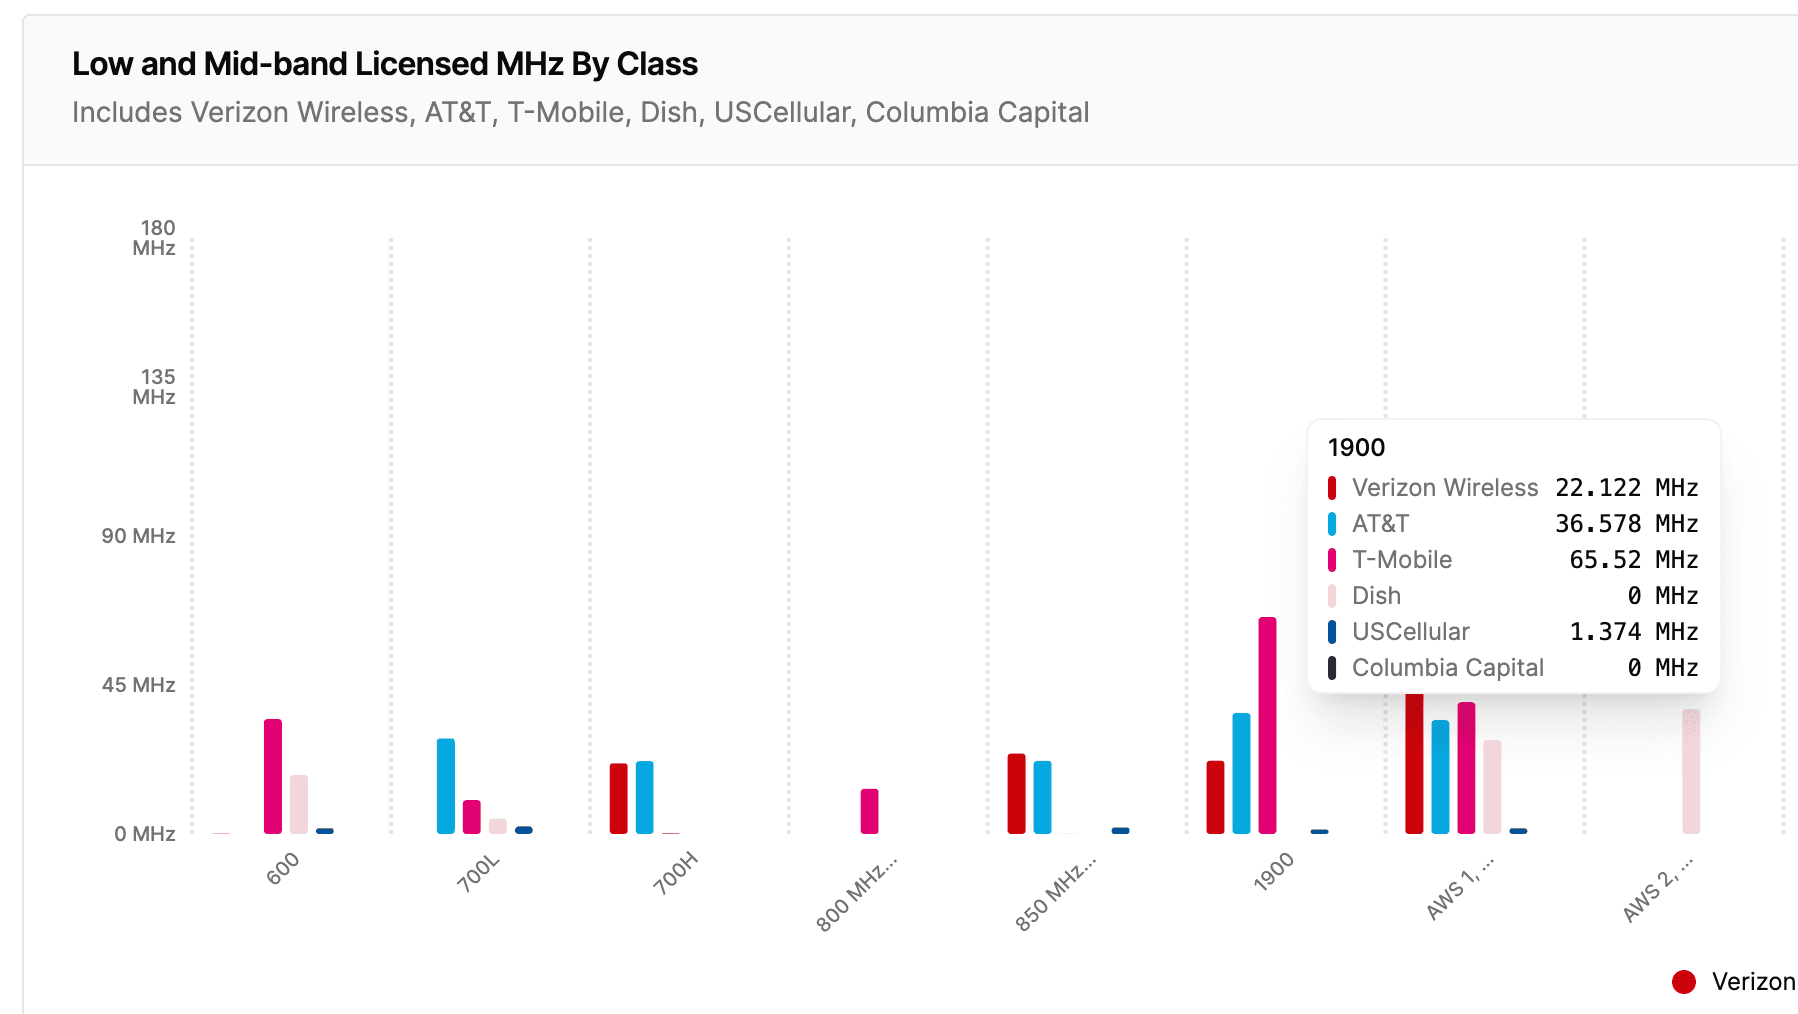
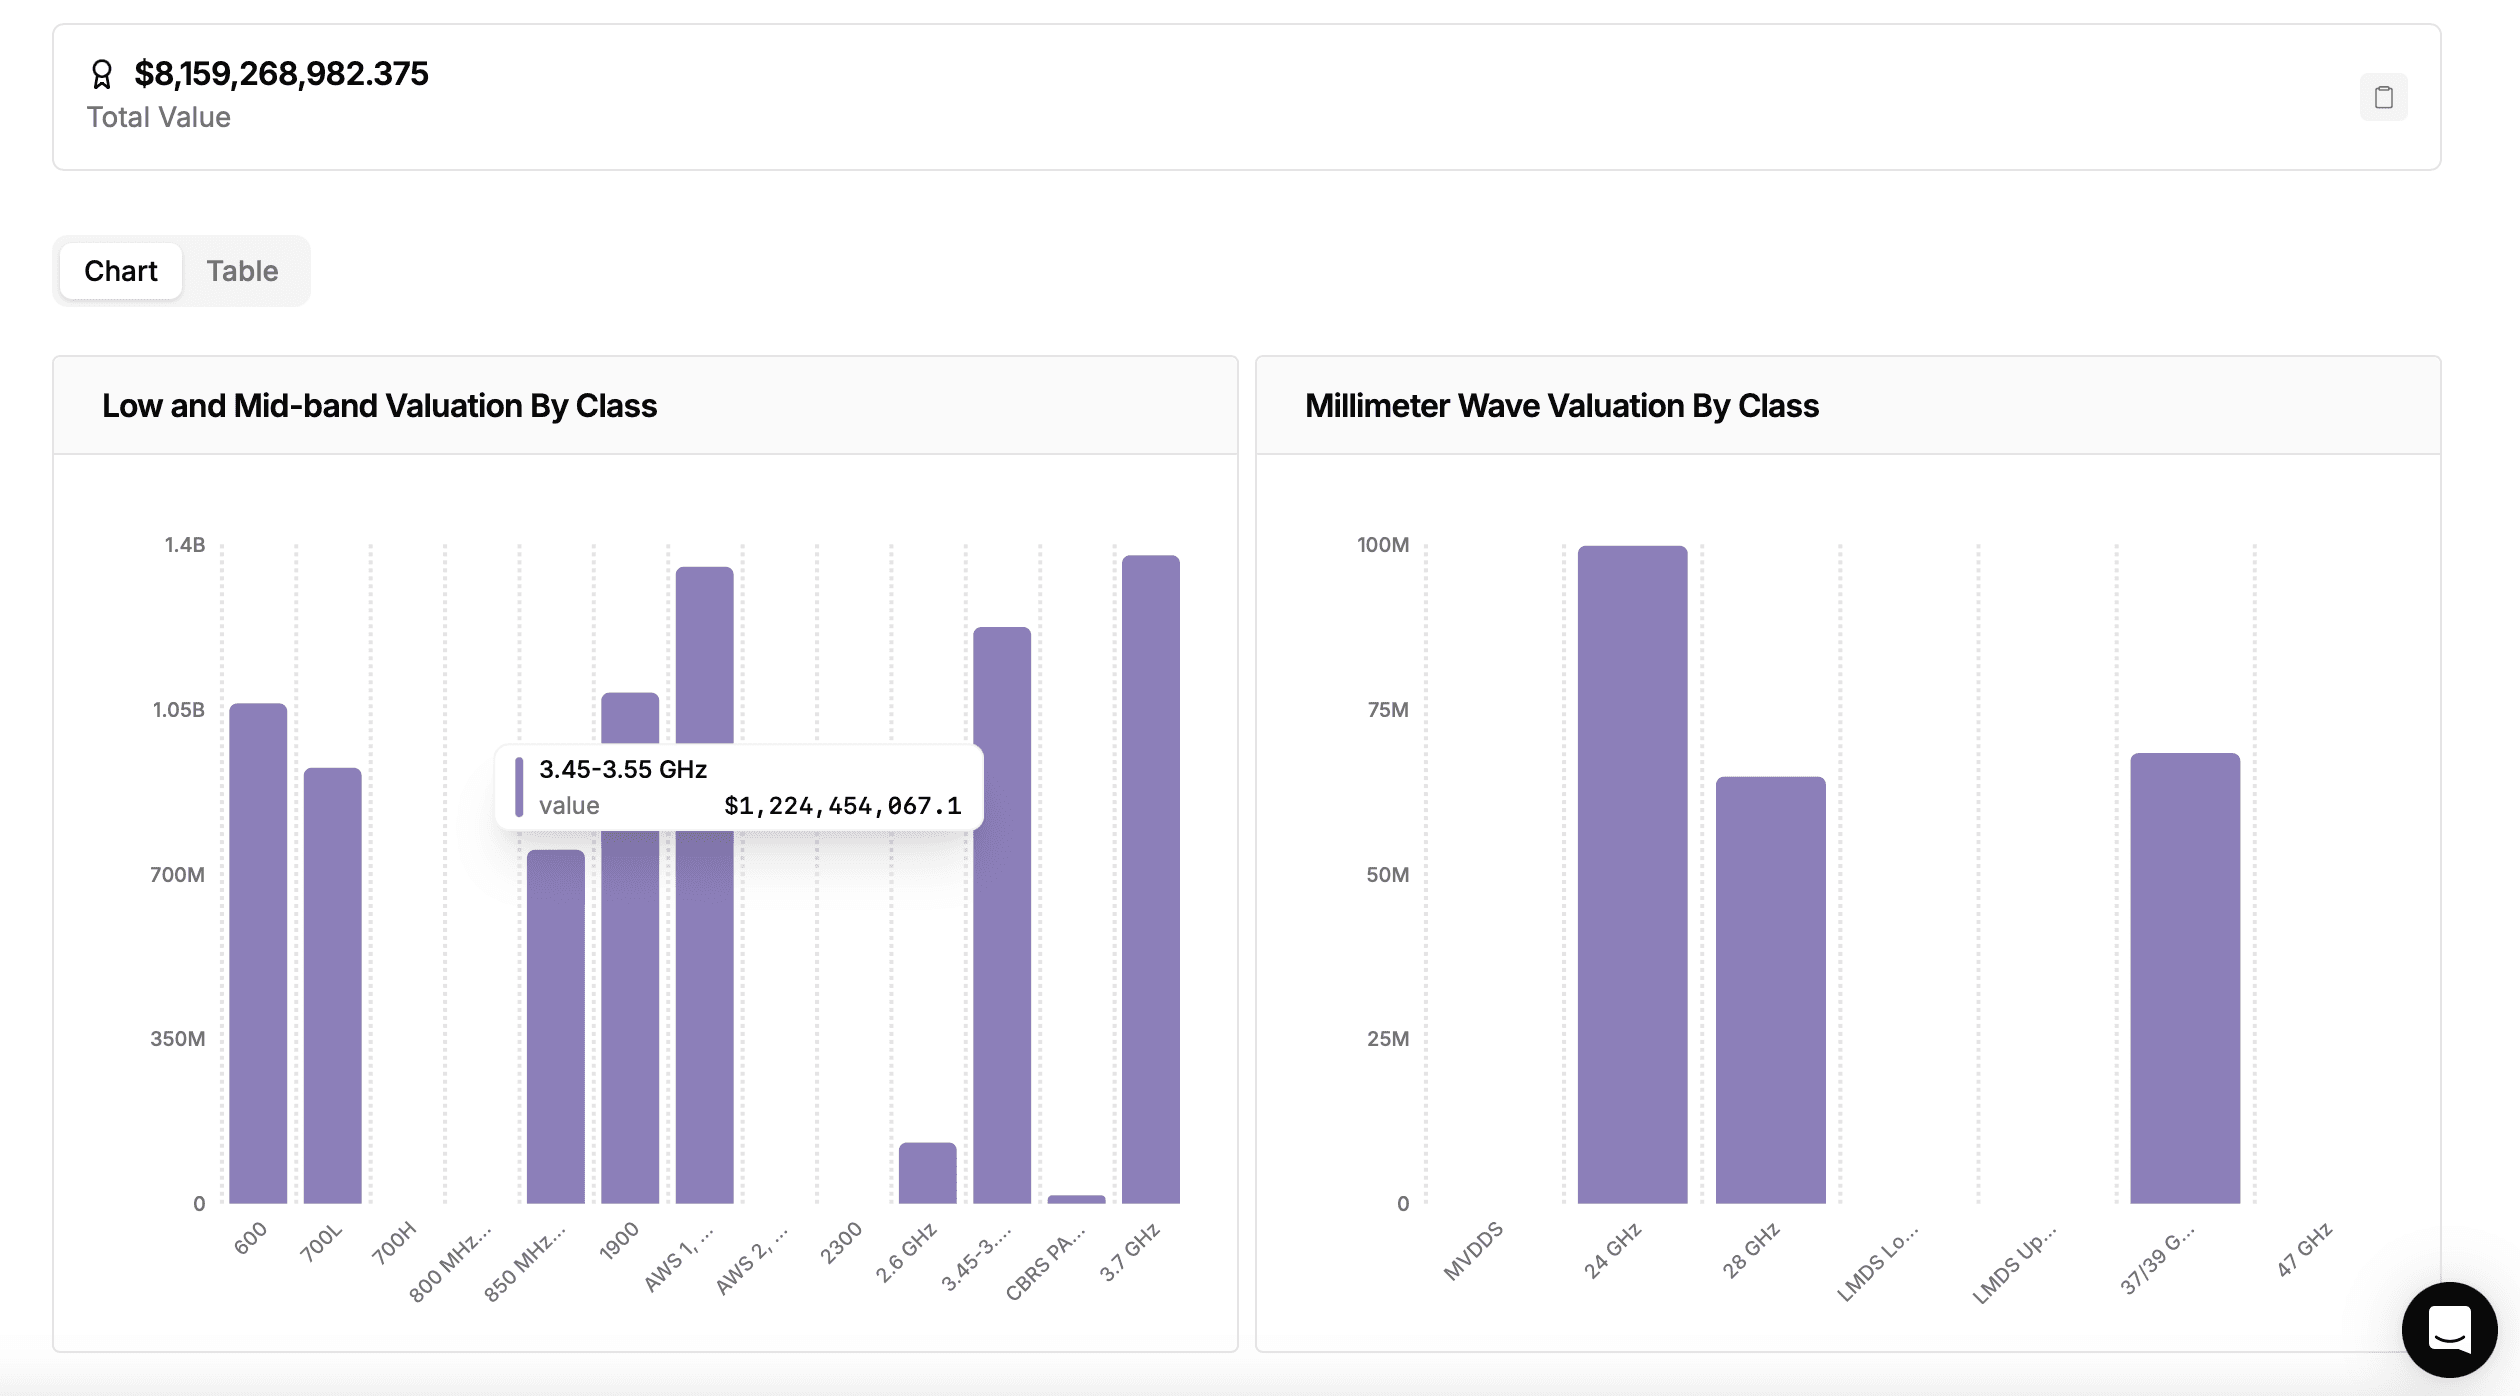
Powerful Aggregated Analytics
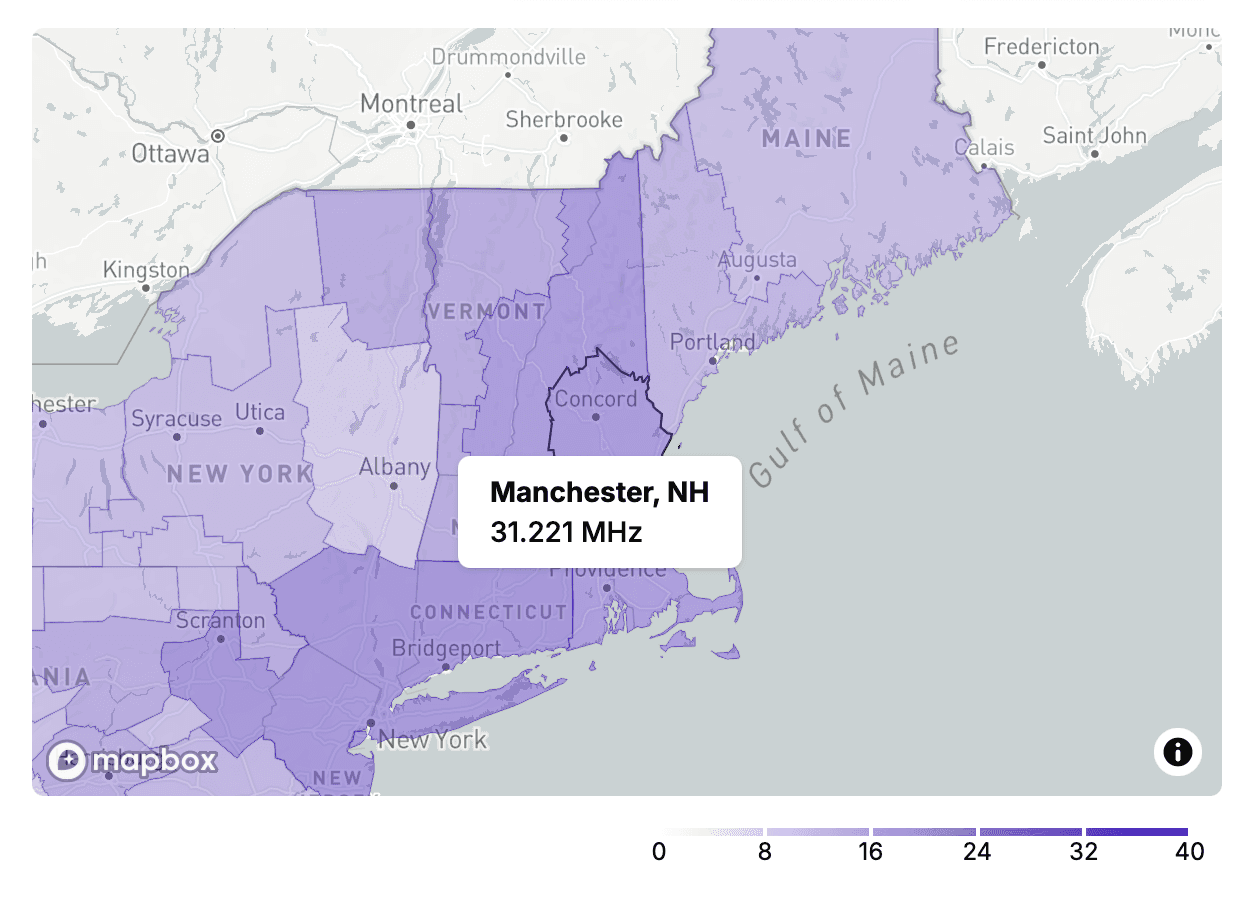
Aggregate spectrum holdings with advanced filters to compare spectrum holdings across multiple dimensions. Get weighted MHz and MHz-Pop's broken down by band and market.
A true competitive advantage.
Transact with confidence.
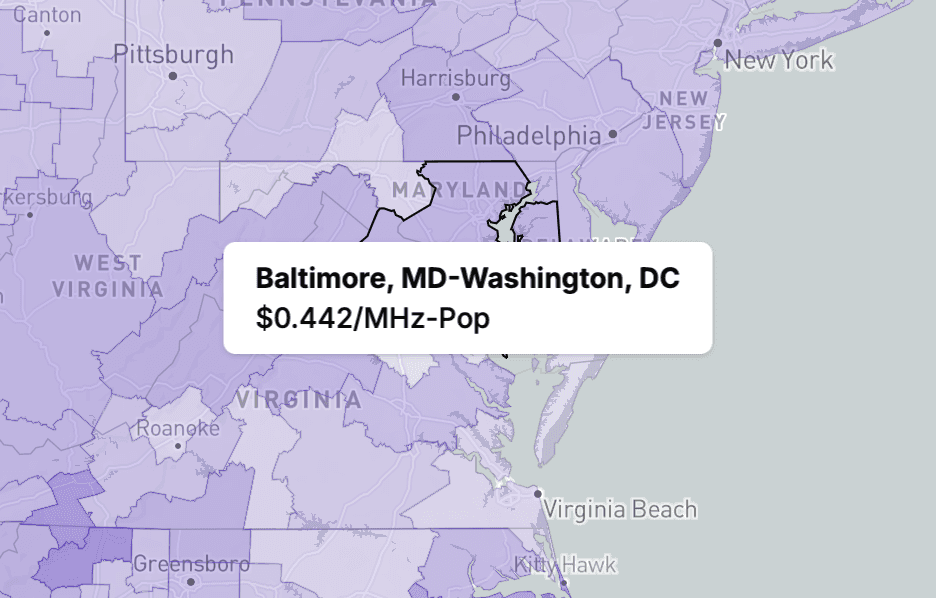
Historical Valuation Data
Access a database of auction results and secondary market transactions to understand the price paid for spectrum in the past.
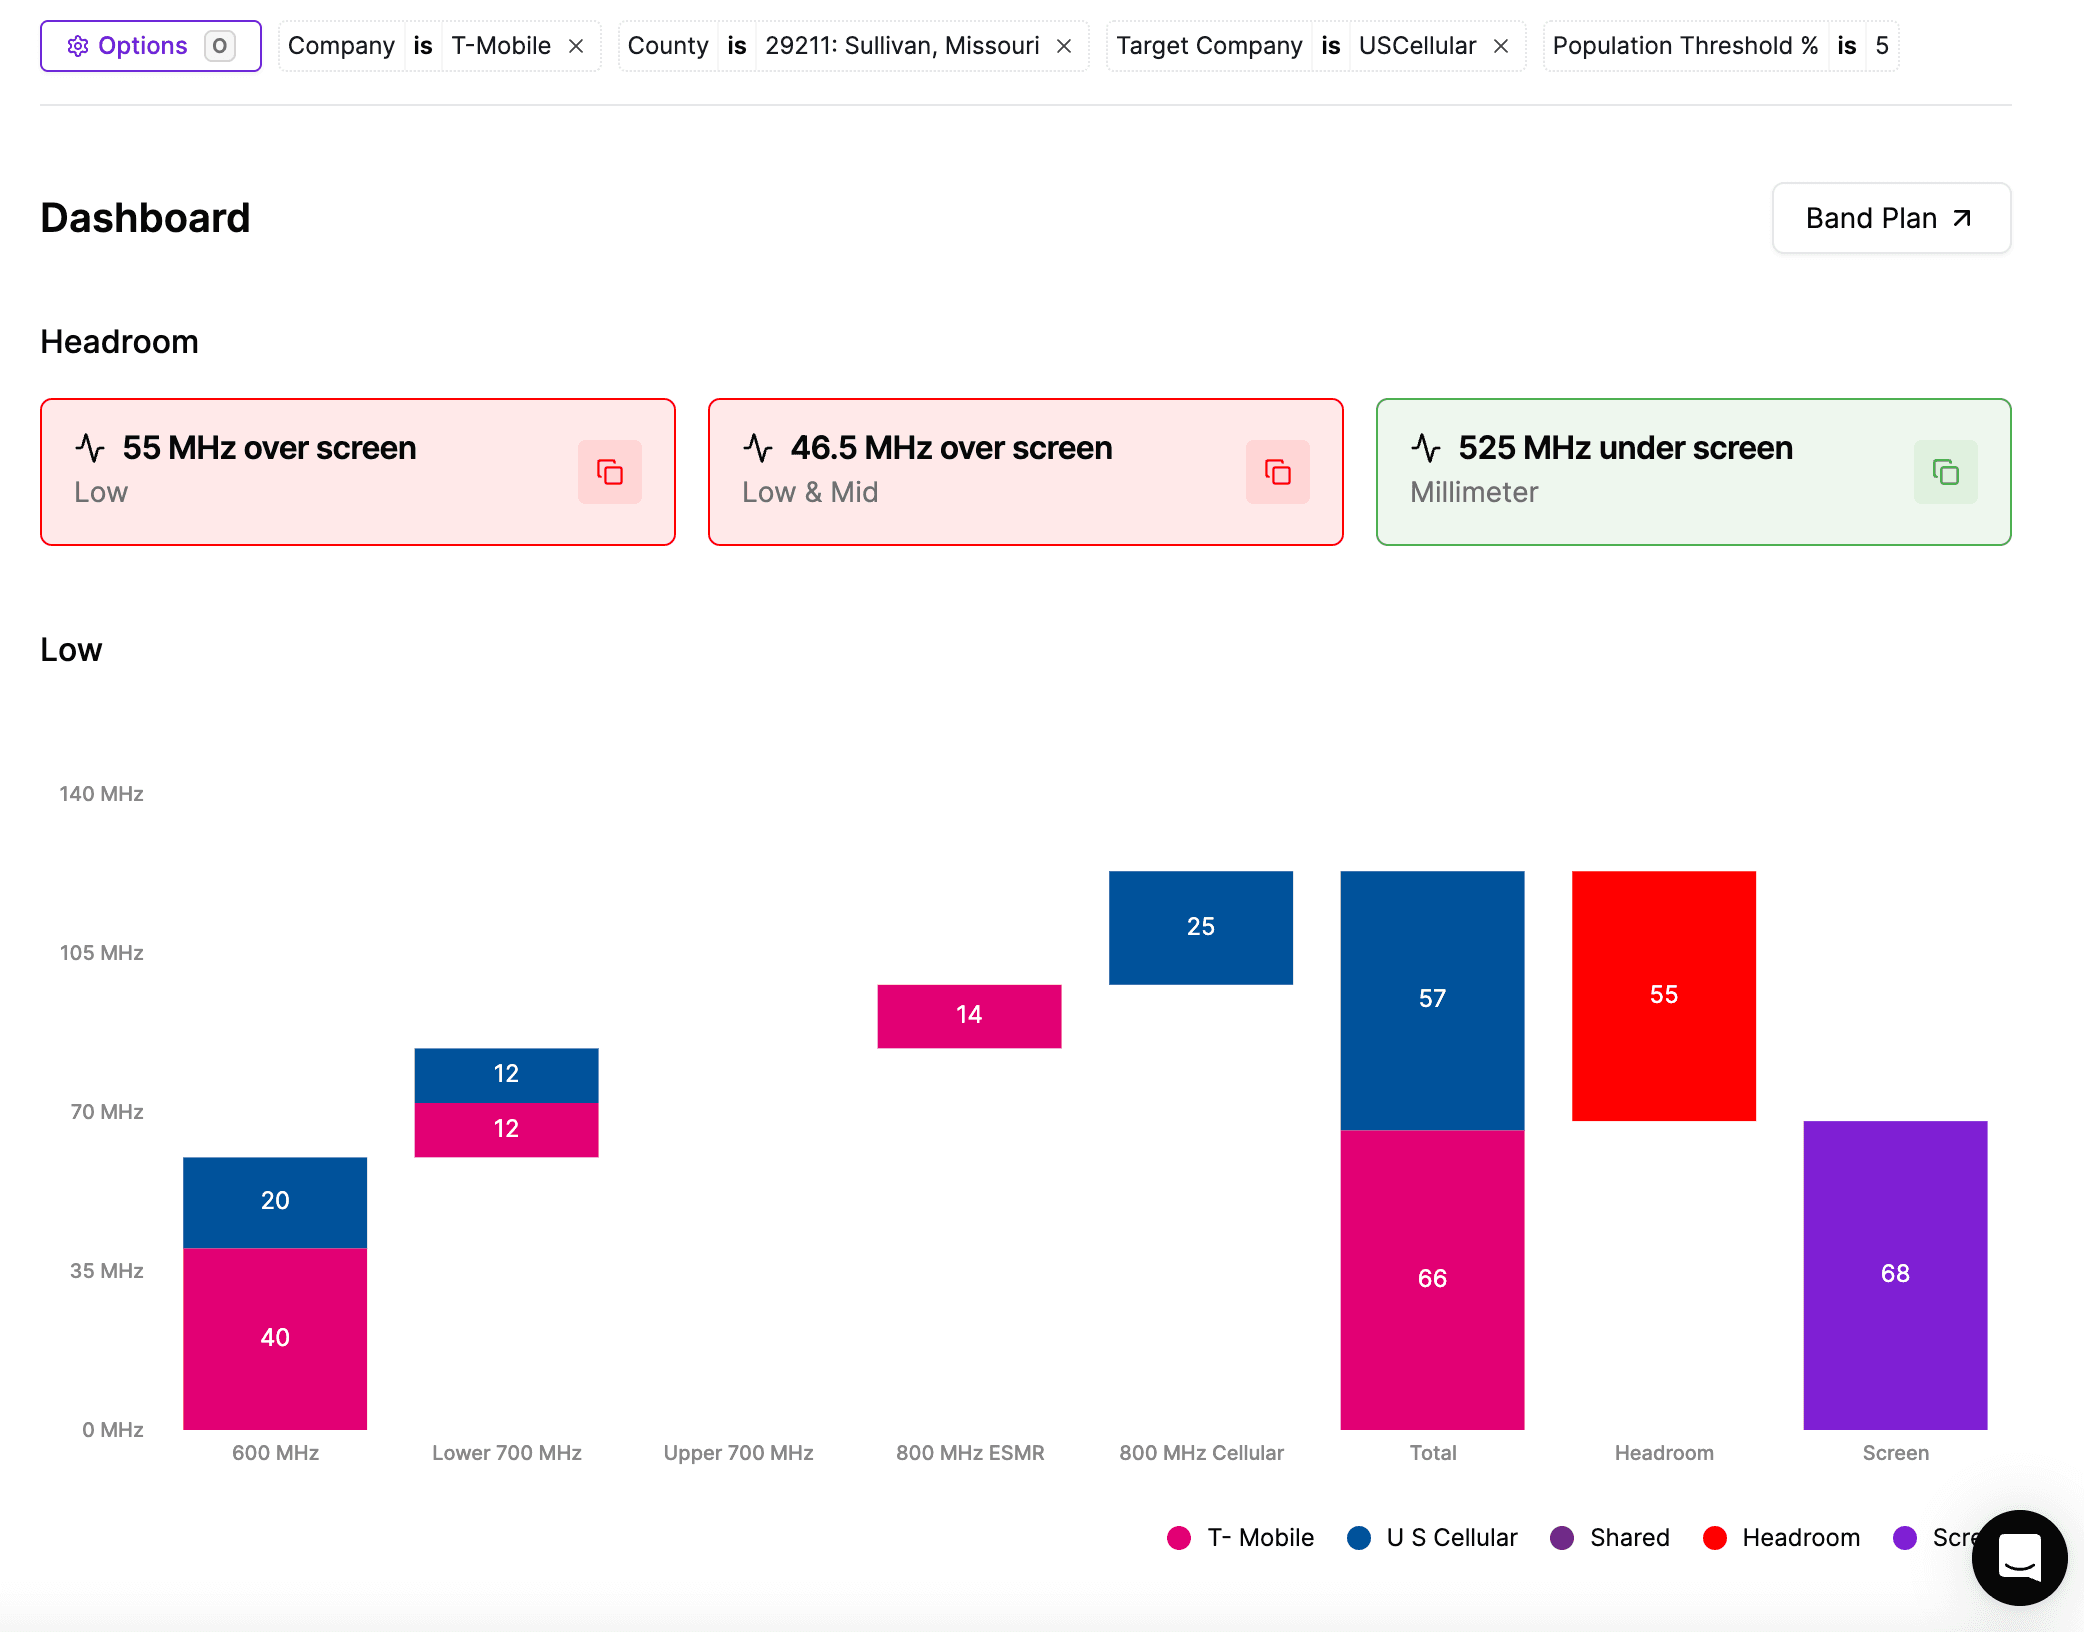
Spectrum Screen Outcomes
Understand where an enhanced review by the FCC may be required in a transaction scenario. Define a specific scenario with our powerful customization options.

ARV Estimate
Value any spectrum license or portfolio with our proprietary valuation model, Airwave Research Valuation (ARV).
Custom Portfolio Valuation
Easily cross-reference user-defined prices with spectrum holdings to come up with your own valuation, broken down by band and optionally indexed by market.
Integrated with your workflow.
Export your data to Excel and GeoJSON with ease.
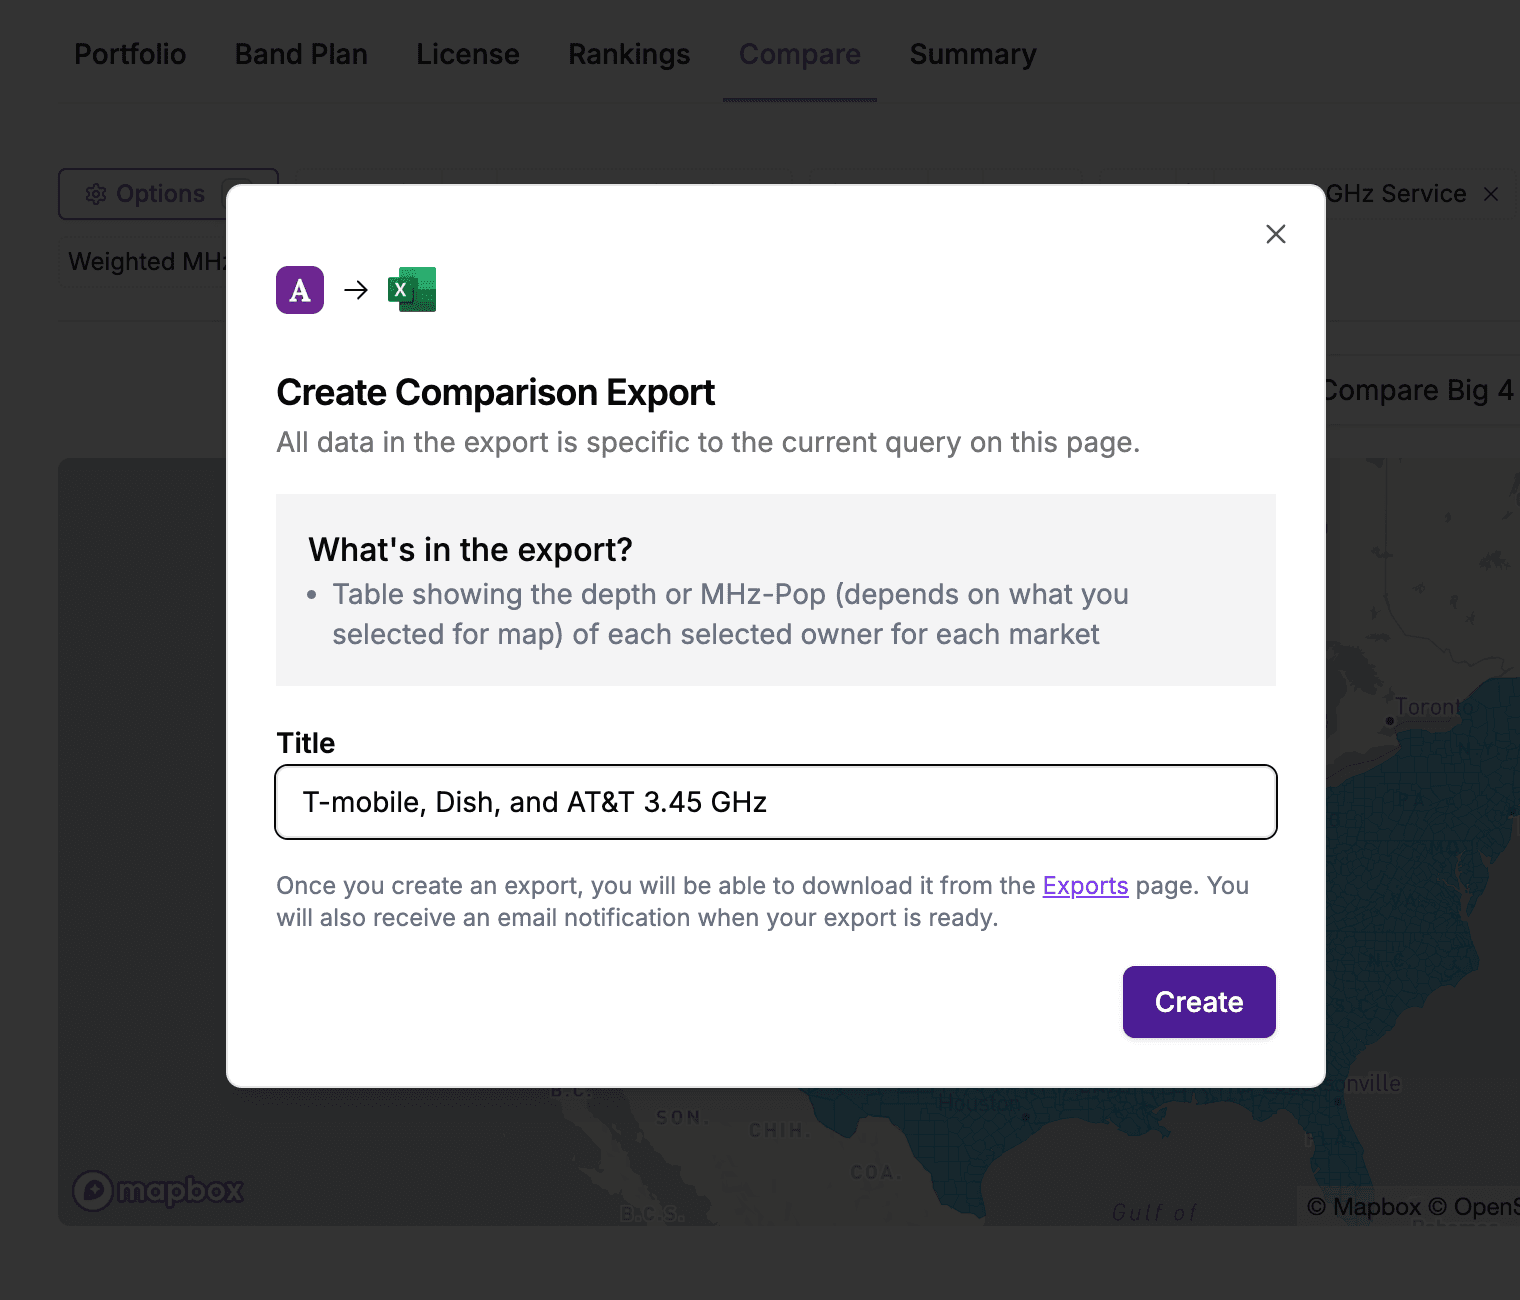
Direct Export from Current Query
Whether you are looking at a map, chart, or table, you can export the results of the current query to Excel or GeoJSON with a single click.
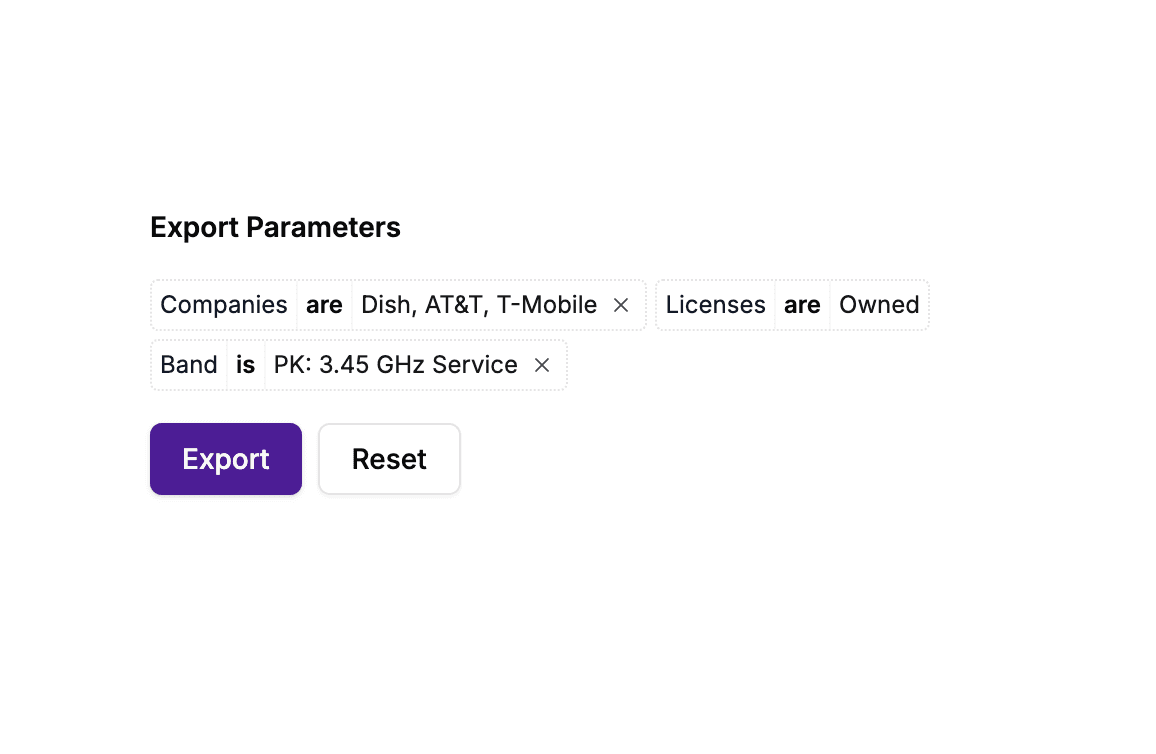
Raw Export
Produce a complete or filtered data dump of the spectrum holdings dataset to CSV format.
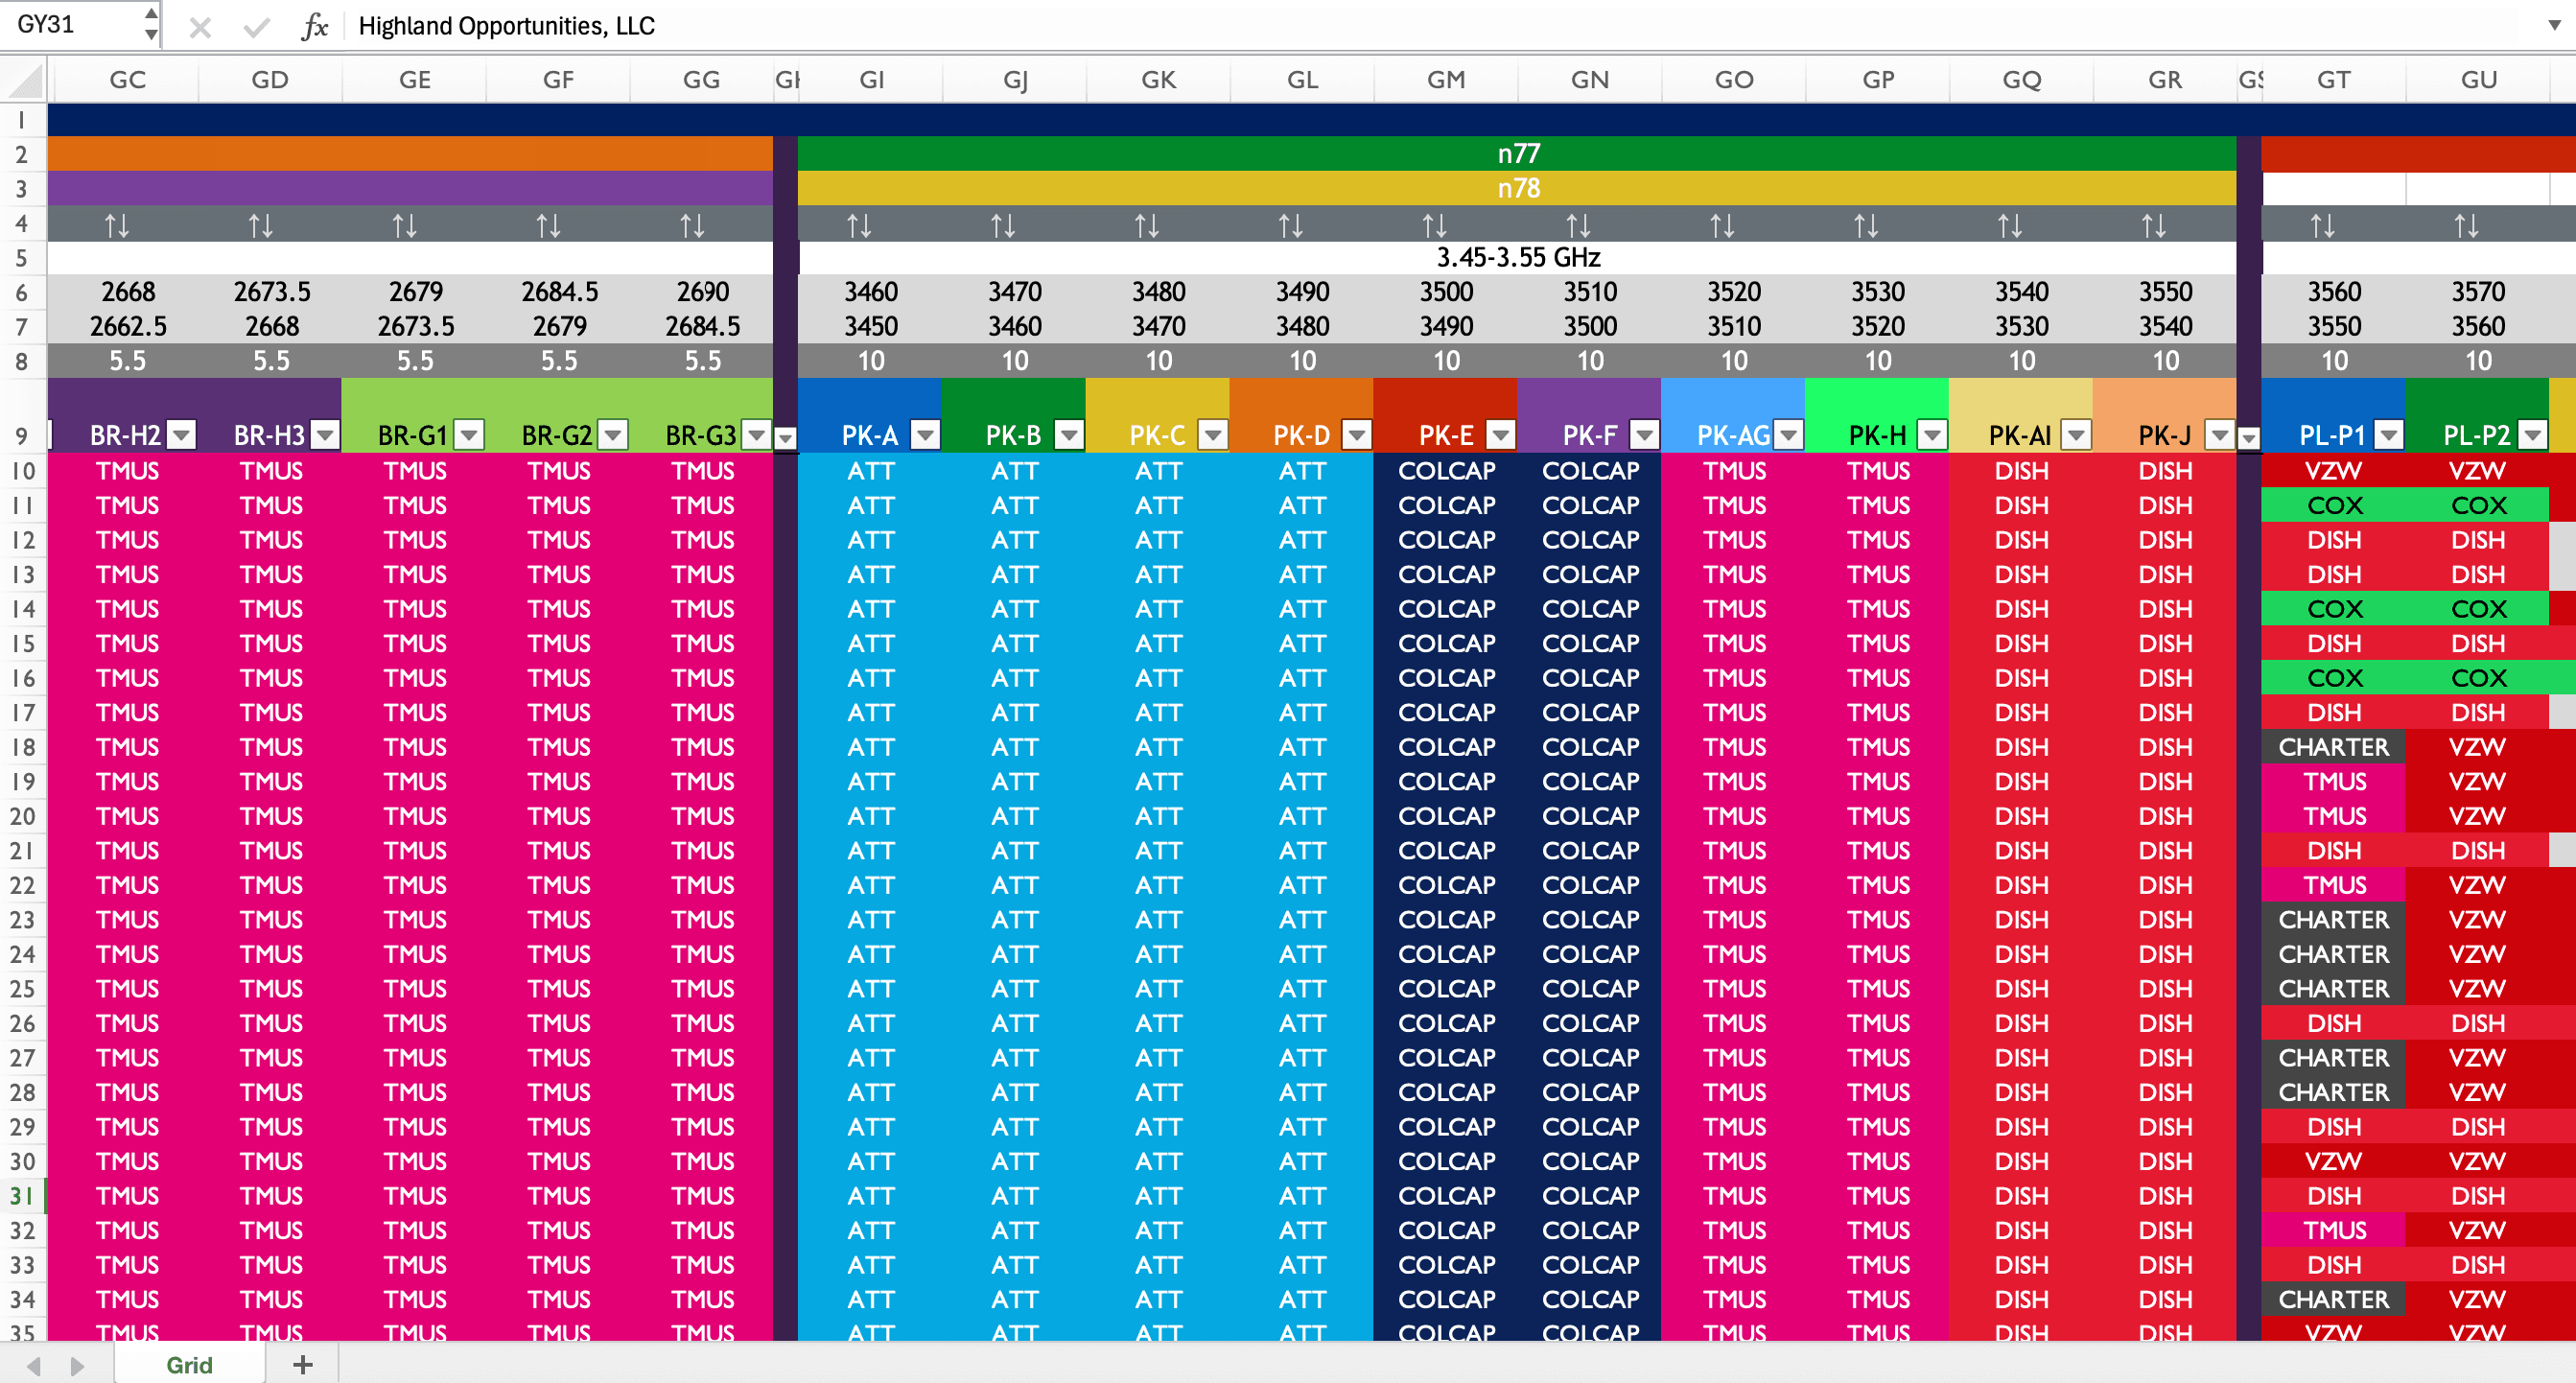
National Spectrum Grid
View the spectrum holder for each county and block across the US and Territories. The file is updated daily and includes low, mid, and high band spectrum.
A complete platform
Airwave Research was built to be an all-in-one platform for spectrum research.
- Powerful maps. Select any FCC boundary for map visualizations. Click on any location to narrow down your search.
- Full spectrum coverage.
- 600 Mhz
- 700L
- 700H
- ESMR
- Cellular
- AWS
- AWS-2
- AWS-3
- AWS-4
- PCS
- WCS
- CBRS
- C-Band
- BRS/EBS
- MVDDS
- 24Ghz
- 28Ghz
- LMDS
- 37/39Ghz
- 47Ghz
- ...and more
- Web-based platform. Access Airwave from any device with a modern web browser. No installation required.
- Full geographic coverage for US & Territories. We cover all 50 states, DC, and territories.
- Always up-to-date. Our data is always up-to-date with the FCC’s database. We update our data every day.
- Exports and modern REST API. Export data to Excel or GeoJSON files. For technical teams, we offer a modern REST API for programmatic access to data.
Insights at your fingertips.
Stop wrestling with gigabyte Excel spreadsheets and outdated dashboards. Start finding answers with Airwave.